


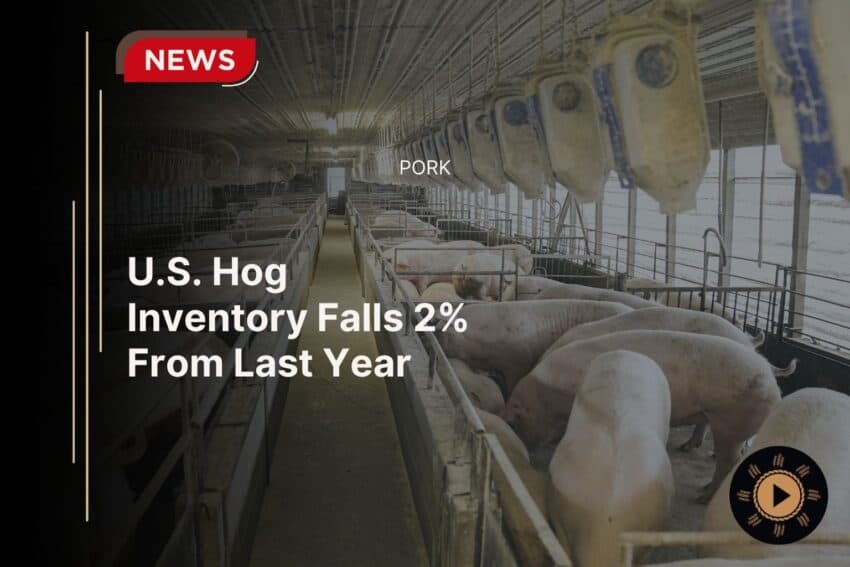
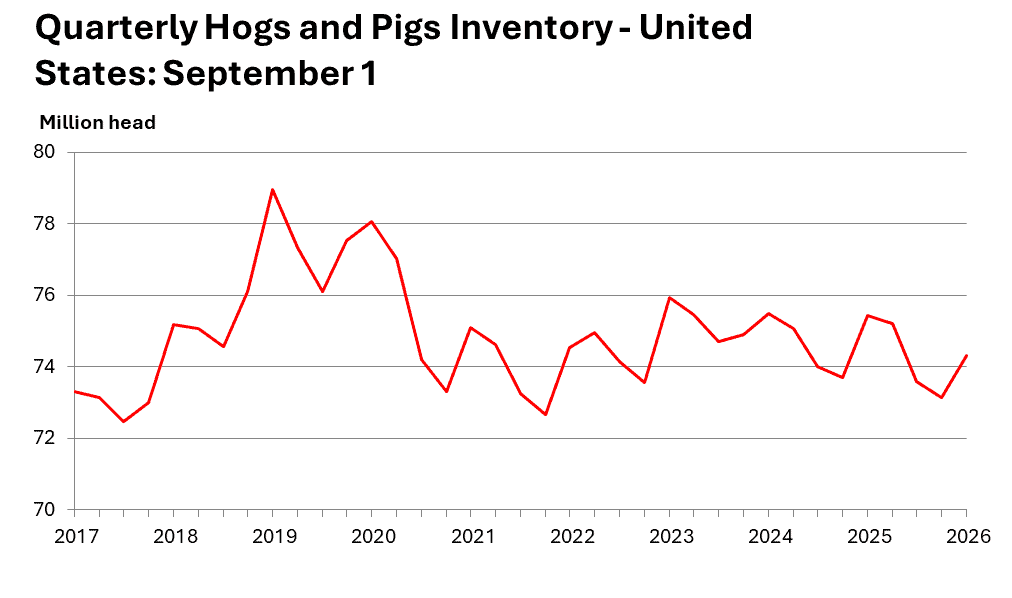
The U.S. hog inventory stood at 74.3 million head as of Sept. 1, 2026, according to the Quarterly Hogs and Pigs report released Sept. 24 by the U.S. Department of Agriculture’s National Agricultural Statistics Service (NASS). That figure is down 2% from September 2025, but it climbed 2% from June 1, 2026. NASS gathered the data by surveying 4,258 hog operators nationwide during the first half of September, using online, mail, phone and in-person interviews.
Market Hogs and Breeding Stock Make Up the Total
Of the 74.3 million hogs and pigs counted, 68.4 million were market hogs raised for meat production. Meanwhile, producers kept 5.87 million animals for breeding purposes. This breakdown helps analysts gauge both current supply and future production capacity within the livestock sector.
Weaning Numbers and Litter Sizes Show Modest Declines
Between June and August 2026, U.S. farms weaned 34.5 million pigs. That total fell 2% compared to the same three-month period a year earlier. However, litter sizes held fairly steady, as producers weaned an average of 11.96 pigs per litter during that stretch.
These numbers matter because weaning rates and litter sizes directly shape how many hogs reach market months later. Consequently, small shifts in either figure can ripple through pork supplies and pricing well into next year.
Farrowing Intentions Point to Steady Production Ahead
Looking forward, hog producers intend to have 2.85 million sows farrow between September and November 2026. They also plan for 2.80 million sows to farrow between December 2026 and February 2027. Because farrowing intentions signal future pig supplies, these figures give buyers and processors an early look at what to expect in the coming year.
Iowa Leads the Nation in Hog Inventory
Iowa remained the top hog-producing state, with 24.7 million head as of Sept. 1. Minnesota ranked second at 9.30 million head, while North Carolina came in third with 7.60 million head. Together, these three states continue to anchor a large share of the nation’s pork production.
For farmers and ranchers who track these numbers, the state-by-state breakdown offers useful context for regional markets and transportation planning. Additionally, it helps smaller producers benchmark their own operations against major hog-producing regions.
What the Hog Inventory Numbers Mean for Producers
Overall, this quarter’s hog inventory data shows a modest cooling from last year but a seasonal uptick since June. That pattern suggests producers are adjusting herd sizes in response to feed costs, demand and market conditions rather than making dramatic shifts. For those in agribusiness, the report offers a snapshot to weigh against feed prices and processing capacity going into 2027.
Farmers and ranchers should watch the December Hogs and Pigs report closely, since it will reveal whether farrowing intentions hold steady or shift again. You can find the full report and more agricultural statistics at USDA NASS’s newsroom. This story is based on a press release from the U.S. Department of Agriculture’s National Agricultural Statistics Service.